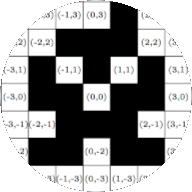
The squares on a chess board are represented by elements of the Cartesian product \(\{a,b,c,d,e,f,g,h\}\times \{1,2,3,4,5,6,7,8\}\text{.}\)
Section 6.3 Applications of Cartesian Products
We can visualize a Cartesian product of two sets as a raster — a rectangular pattern of points. In Figure 6.3.5 we represent the set \(\{0,1,2\}\times\{0,1,2,3,4\}\) in this way.
The video in Figure 6.3.1 reviews ordered pairs and Cartesian products. It also explains graphical representations of Cartesian products. A more detailed discussion follows.
This way of showing Cartesian products has many uses. It can represent many real-life objects.
Example 6.3.2. Chess board as a Cartesian product.
Most computers display images as a raster of points called pixels. Each pixel can be located by its coordinates. These coordinates are ordered pairs, so they are elements of a Cartesian product. We represent an image by coloring the points that match elements of a subset of the Cartesian product shown by the raster.
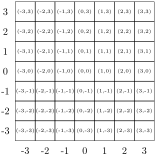
Raster consisting of seven rows and seven columns. T The rows are labeled 3,2,1,0,-1,-2,-3 from top to bottom. The columns are labeled -1,-2,-3,0,1,2 from left to right. The cells or pixels in the raster are all white.
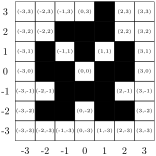
Raster consisting of seven rows and seven columns. The rows are labeled 3,2,1,0,-1,-2,-3 from top to bottom. The columns are labeled -1,-2,-3,0,1,2 from left to right. The cells or pixels in the raster are black or white.
First row, labeled 3: white, white, white, white, black, white, white; Second row, labeled 2: white, white, black, black, black, white, white; Third row, labeled 1: white, black, white, black, white, black, white; Fourth row, labeled 0: white, black, black, white, black, black, white; Fifth row, labeled -1: white, white, black, black, black, white, white; Sixth row, labeled -2: white, black, black, white, black, black, white; Seventh row, labeled -3: white, white, white, white, white, white, white.
Example 6.3.4. The images in Figure 6.3.3 as sets of pairs.
Figure 6.3.3.(a) shows the Cartesian product \(G=\{-3,\dots,3\}\times \{-3,\dots,3\}\) as a raster made of rectangles called pixels. Each element of \(G\) has one pixel.
Figure 6.3.3.(b) is an example of an image that could be displayed on a computer screen. The image of the “alien” is formed by black pixels in the raster. Let \(I:=\{ (1,3)\text{,}\) \((-1,2)\text{,}\) \((0,2)\text{,}\) \((1,2)\text{,}\) \((-2,1)\text{,}\) \((0,1)\text{,}\) \((2,1)\text{,}\) \((-2,0)\text{,}\) \((-1,0)\text{,}\) \((1,0)\text{,}\) \((2,0)\text{,}\) \((-1,-1)\text{,}\) \((0,-1)\text{,}\) \((1,-1)\text{,}\) \((-2,-2)\text{,}\) \((-1,-2)\text{,}\) \((1,-2)\text{,}\) \((2,-2) \}\text{.}\) Then, the subset \(I\) of \(G\) defines the set of black pixels that forms the image in the raster.
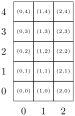
Raster consisting of five rows and three columns. T The rows are labeled 4,3,2,1,0 from top to bottom. The columns are labeled 0,1,2 from left to right. The cells or pixels in the raster are all white.
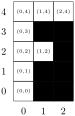
Raster consisting of five rows and three columns. T The rows are labeled 4,3,2,1,0 from top to bottom. The columns are labeled 0,1,2 from left to right. The cells or pixels in the raster are black and white.
First row, labeled 4: black, black, black; second row, labeled 3: black, white, white; third row, labeled 2: black, black, white; fourth row, labeled 1: black, white, white; fifth row, labeled 0: black, white, white.
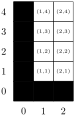
Raster consisting of five rows and three columns. T The rows are labeled 4,3,2,1,0 from top to bottom. The columns are labeled 0,1,2 from left to right. The cells or pixels in the raster are black and white.
First row, labeled 4: white, white, white; second row, labeled 3: white, black, black; third row, labeled 2: white, white, black; fourth row, labeled 1: white, black, black; fifth row, labeled 0: white, black, black.
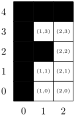
Raster consisting of five rows and three columns. T The rows are labeled 4,3,2,1,0 from top to bottom. The columns are labeled 0,1,2 from left to right. The cells or pixels in the raster are black and white.
First row, labeled 4: black, white, white; second row, labeled 3: black, white, white; third row, labeled 2: black, white, white; fourth row, labeled 1: black, white, white; fifth row, labeled 0: black, black, black.
Example 6.3.6. Letters as sets of pairs.
In Figure 6.3.5, we represent the set \(G=\{0,1,2\}\times \{0,1,2,3,4\}\) as a raster with the elements of several subsets given in black.
-
Let \(F:=\{(0,4),(1,4),(2,4),(0,3),(0,2),(1,2),(0,1),(0,0)\}\text{.}\) In Figure 6.3.5.(b) the black pixels represent the set \(F\) as a subset of the set \(G\text{.}\) The subset \(F\) of \(G\) forms a picture of the letter F.
-
Let \(H\) be the set that contains all elements of \(G\) that are not in \(F\text{.}\) This is the set of pairs \(H := \{(1,0),(2,0),(1,1),(2,1),(2,2),(1,3),(2,3)\}\text{.}\) In Figure 6.3.5.(c) the black pixels represent the set \(H\) as a subset of the set \(G\text{.}\)
-
Let \(L:=\{(0,4), (0,3), (0,2), (0,1), (0,0), (1,0), (2,0) \}\text{.}\) In Figure 6.3.5.(d) the black pixels represent the set \(L\) as a subset of the set \(G\text{.}\) The subset \(L\) of \(G\) looks like the letter L.
In Example 6.3.7 observe how the subset changes when its graphical representation changes.

